


Area chart
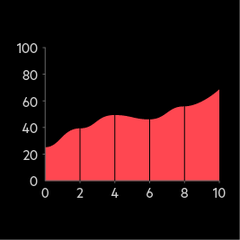
Question example:
How has your organisation's travel budget changed over the past year?
Area chart stacked

Question example:
Which digital transformation initiatives have you prioritised in the past three years?
Bar chart

Question example:
Which factor is most important to you when you choose a cloud provider?
Bar chart diverging

Question example:
Rate your agreement with the following statement: 'Remote work is more productive than in-office work.'
Bar chart diverging stacked

Question example:
Rate your agreement with the following statements about workplace culture on a scale of 1 (strongly disagree) to 5 (strongly agree).
Bar chart grouped

Question example:
How satisfied are you with your current work-life balance? [Group by job level]

Bar chart proportional stacked

Question example:
Which area of corporate social responsibility does your company prioritise most?
Bar chart stacked

Question example:
What's your main reason for not investing in renewable energy?
Box plot

Question example:
On a scale of 1 to 10, how would you rate your company's overall performance in terms of digital transformation?
Bubble map

Question example:
In which countries does your company generate the most revenue?

Choropleth map

Question example:
What is the average employee engagement score for each region where your company operates?

Column chart grouped

Question example:
What is your preferred method of communication for business purposes?
Column chart ordered

Question example:
Rank the following leadership qualities in order of their importance to your role.
Column chart stacked

Question example:
How do you allocate your marketing budget across different channels?
Column-line chart

Question example:
How have your company's revenue [column] and employee satisfaction [line] changed over the past five years?
Control chart

Question example:
Track the average time to resolve customer complaints over the past 6 months.
Dot density map

Question example:
In which regions do you see the greatest potential for growth in your industry over the next five years?
Dot matrix chart

Question example:
Which of the following sustainability practices has your company implemented? [e.g. recycling, renewable energy use, waste reduction.]
Dot plot

Question example:
How confident are you, on a scale of 1 to 10, in your company's ability to adapt to AI, blockchain and quantum computing?
Dot plot strip

Question example:
How confident are you, on a scale of 1 to 10, in your company's ability to adapt to AI, blockchain and quantum computing?
Doughnut chart

Question example:
What is your company's primary focus? [Profit, growth, innovation, sustainability.]
Dumbbell plot horizontal

Question example:
What percentage of your company's annual budget is allocated to digital transformation initiatives?
Dumbbell plot vertical

Question example:
What percentage of your company's annual budget is allocated to digital transformation initiatives?
Funnel chart

Question example:
How satisfied are you with your current employer's sustainability initiatives?
Gauge

Question example:
On a scale of one to 10, how would you rate your company's overall innovation performance?
Geographic heatmap

Question example:
What is the average employee salary in each region where your company operates?
Grid plot

Question example:
What percentage of your company's workforce is made up of each generation? (Baby Boomers, Gen X, Millennials, Gen Z.)
Line graph

Question example:
Over the past five years, how has your company's view of the importance of environmental, social, and governance factors in investment decisions changed?
Lollipop chart horizontal

Question example:
On a scale of 1 (not important) to 10 (extremely important), rate the following things to consider when you pursue a new strategic partnership.
Lollipop chart vertical

Question example:
On a scale of 1 (not important) to 10 (extremely important), rate the following things to consider when you pursue a new strategic partnership.
Marimekko chart

Question example:
Which of these emerging technologies are you currently investing in, and what impact do you expect them to have on your business?
Parallel coordinates

Question example:
What are your company's key performance indicators for the following departments: sales, marketing, operations?
Parallel sets horizontal

Question example:
In your company, how do employees typically move between different roles?
Parallel sets vertical

Question example:
In your company, how do employees typically move between different roles?
Pictorial percentage chart

Question example:
What's your company's primary target market (small business/mid-market/enterprise)?
Pie chart

Question example:
What percentage of your company's workforce is made up of each generation (baby boomers, gen X, millennials, gen Z)?
Progress bar

Question example:
On a scale of 0% to 100%, how far has your company got towards its net zero goals?
Proportional area chart

Question example:
What percentage of your company's revenue comes from each of the following revenue streams?
Proportional area chart half circle

Question example:
What percentage of your company's workforce is remote, and what proportion is in the office?
Proportional area chart ordered

Question example:
Rank the top five factors that influence your decision to partner with a technology vendor.
Proportional area chart square

Question example:
What percentage of your company's revenue comes from each of the following revenue streams?
Pyramid chart

Question example:
How would you categorise your company in terms of its approach to innovation (laggard, follower, challenger, leader)?
Quadrant chart

Question example:
Rate your company's current performance and future potential in terms of digital transformation and customer satisfaction.
Radar chart

Question example:
Rate your company's performance in these areas from one to five: innovation, customer service, financial performance, employee engagement, and social responsibility.
Radar chart outline

Question example:
Rate your company's performance in these areas from one to five: innovation, customer service, financial performance, employee engagement, and social responsibility.
Radial bar chart

Question example:
What percentage of your employees are satisfied with the following aspects of their job: compensation, benefits, work-life balance, career development and company culture?
Radial column chart

Question example:
How important are the following factors in your decision to partner with another company: financial performance, ESG rating, market trends, company leadership, brand reputation?
Range area chart

Question example:
What is the range of estimated return on investment (ROI) for your company's new product launch, based on different market scenarios?
Scatter plot connected

Question example:
Over the past five years, how has your company's approach to diversity and inclusion initiatives changed?
Scatterplot

Question example:
Explore the relationship between employee engagement scores and customer satisfaction ratings.
Semicircle doughnut chart

Question example:
What percentage of your company's employees work remotely and what percentage work in the office?
Slope chart

Question example:
How has your latest rebranding exercise changed your customers' perception of your company?
Sorted stream graph

Question example:
How has the popularity of different cloud computing providers changed among your company's target audience?
Span graph horizontal

Question example:
On a scale of 1 (not prepared) to 10 (extremely prepared), rate your company's preparedness for various types of disruptions (e.g. cyber attack, supply chain disruption).
Span graph vertical

Question example:
On a scale of 1 (not prepared) to 10 (extremely prepared), rate your company's preparedness for various types of disruptions (e.g. cyber attack, supply chain disruption).
Spine chart

Question example:
To what extent do you agree or disagree with the following statements about your company's commitment to diversity and inclusion? (Compare the distribution across male and female employees.)
Trendline

Question example:
How has the number of cyber attacks targeting your industry changed over the past five years?