


Area chart
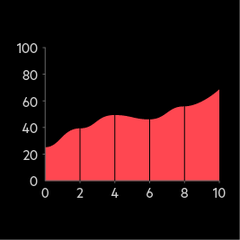
Question example:
How has your organisation's travel budget changed over the past year?
Area chart stacked

Question example:
Which digital transformation initiatives have you prioritised in the past three years?
Bar chart

Question example:
Which factor is most important to you when you choose a cloud provider?
Bar chart diverging

Question example:
Rate your agreement with the following statement: 'Remote work is more productive than in-office work.'
Bar chart diverging stacked

Question example:
Rate your agreement with the following statements about workplace culture on a scale of 1 (strongly disagree) to 5 (strongly agree).
Bar chart grouped

Question example:
How satisfied are you with your current work-life balance? [Group by job level]

Bar chart proportional stacked

Question example:
Which area of corporate social responsibility does your company prioritise most?
Bar chart stacked

Question example:
What's your main reason for not investing in renewable energy?

Column chart grouped

Question example:
What is your preferred method of communication for business purposes?
Column chart ordered

Question example:
Rank the following leadership qualities in order of their importance to your role.
Column chart stacked

Question example:
How do you allocate your marketing budget across different channels?
Column-line chart

Question example:
How have your company's revenue [column] and employee satisfaction [line] changed over the past five years?
Compound bubble and pie chart

Question example:
Which cloud provider does your company use? [Bubble size = company revenue] Within that provider, which services do you use most? [Pie slices = IaaS, PaaS, SaaS]
Control chart

Question example:
Track the average time to resolve customer complaints over the past 6 months.
Cumulative curve

Question example:
Show the cumulative number of new customers acquired each quarter. [QUERY: This isn't a question we'd ask in a survey..? ]
Doughnut chart

Question example:
What is your company's primary focus? [Profit, growth, innovation, sustainability.]
Fan chart

Question example:
What are your company's projected revenue growth scenarios for the next five years, considering different economic factors?
Funnel chart

Question example:
How satisfied are you with your current employer's sustainability initiatives?
Gantt chart

Question example:
What are the most important milestones of your upcoming digital transformation project?
Histogram

Question example:
In the past year, how many new sustainability initiatives has your company implemented?
Line graph

Question example:
Over the past five years, how has your company's view of the importance of environmental, social, and governance factors in investment decisions changed?
Lollipop chart horizontal

Question example:
On a scale of 1 (not important) to 10 (extremely important), rate the following things to consider when you pursue a new strategic partnership.
Lollipop chart vertical

Question example:
On a scale of 1 (not important) to 10 (extremely important), rate the following things to consider when you pursue a new strategic partnership.
Marimekko chart

Question example:
Which of these emerging technologies are you currently investing in, and what impact do you expect them to have on your business?
Nested proportional area chart

Question example:
How does your company allocate its budget across different departments?
Nightingale rose chart

Question example:
Which of these challenges poses the greatest risk to your company's supply chain operations?
Pictorial percentage chart

Question example:
What's your company's primary target market (small business/mid-market/enterprise)?
Pie chart

Question example:
What percentage of your company's workforce is made up of each generation (baby boomers, gen X, millennials, gen Z)?
Priestley timeline

Question example:
List the milestones or events that have shaped your company's approach to sustainability over the past decade.
Proportional area chart

Question example:
What percentage of your company's revenue comes from each of the following revenue streams?
Proportional area chart half circle

Question example:
What percentage of your company's workforce is remote, and what proportion is in the office?
Proportional area chart ordered

Question example:
Rank the top five factors that influence your decision to partner with a technology vendor.
Proportional area chart square

Question example:
What percentage of your company's revenue comes from each of the following revenue streams?
Pyramid chart

Question example:
How would you categorise your company in terms of its approach to innovation (laggard, follower, challenger, leader)?
Radial bar chart

Question example:
What percentage of your employees are satisfied with the following aspects of their job: compensation, benefits, work-life balance, career development and company culture?
Radial column chart

Question example:
How important are the following factors in your decision to partner with another company: financial performance, ESG rating, market trends, company leadership, brand reputation?
Range area chart

Question example:
What is the range of estimated return on investment (ROI) for your company's new product launch, based on different market scenarios?
Semicircle doughnut chart

Question example:
What percentage of your company's employees work remotely and what percentage work in the office?
Slope chart

Question example:
How has your latest rebranding exercise changed your customers' perception of your company?
Sorted stream graph

Question example:
How has the popularity of different cloud computing providers changed among your company's target audience?
Span graph horizontal

Question example:
On a scale of 1 (not prepared) to 10 (extremely prepared), rate your company's preparedness for various types of disruptions (e.g. cyber attack, supply chain disruption).
Span graph vertical

Question example:
On a scale of 1 (not prepared) to 10 (extremely prepared), rate your company's preparedness for various types of disruptions (e.g. cyber attack, supply chain disruption).
Spine chart

Question example:
To what extent do you agree or disagree with the following statements about your company's commitment to diversity and inclusion? (Compare the distribution across male and female employees.)
Sunburst chart

Question example:
Visualize your company's organizational structure, showing the headcount and budget allocation for each department and sub-department.
Treemap

Question example:
Please indicate the proportion of time your employees spend on various work activities throughout a typical week.
Trendline

Question example:
How has the number of cyber attacks targeting your industry changed over the past five years?
Waterfall chart

Question example:
How have various factors (e.g. new product launches, cost-cutting measures, market fluctuations) affected your company's overall revenue over the past year?